Getting started for Developers
Overview
The main questions that are being answered here are: How to fetch data? and
What to do with the data?.
- Overview
- Different ways of obtaining data
- GraphQL API
- Download CSV from Sanbase
- Analyzing Santiment Data
Different ways of obtaining data
Consuming Santiment data can be done in two main ways:
- By using the Sanbase Web Application. Sanbase allows exploring the data through charts, research in written form of reports and insights and other visual tools.
- By using the Santiment API. The API allows obtaining the data in a JSON format, which will be more suitable for developers.
GraphQL API
If the desired metric is available in the API, using the API is the preferred way to fetch the data. Detailed description and examples can be found on the SanAPI page
The API can be consumed in a few different ways:
- Using the GraphiQL Live Explorer and explore the API with included autocmplete and nice response formatting.
- Using the
/graphqlAPI endpoint withcurldirectly from your terminal. - Using the
/graphqlAPI endpoint and construct requests in your preferred programming language. - Using the
sanpyPython library that wraps the GraphQL API. It is easy to use and hides all GraphQL-related details.
Download CSV from Sanbase
On Sanbase the data from charts can be exported as a CSV file. 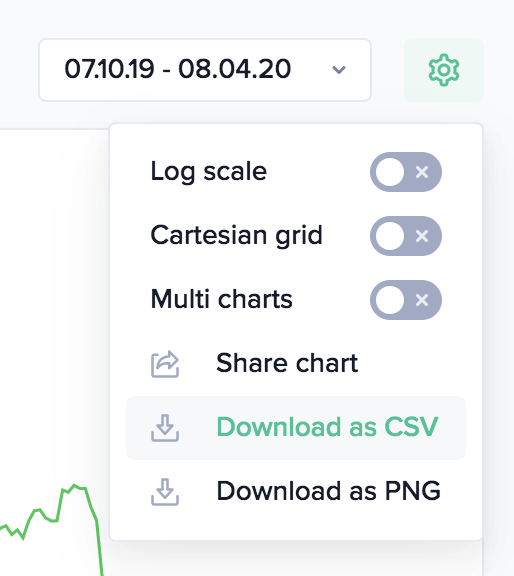
Analyzing Santiment Data
Examples for different analysis based on Santiment data can be found on the Education and use cases page
The are two types of examples included:
- Code examples showing how to analyze the data and plot the results.
- Descriptions how to use the tools provided by the Sanbase web application and interpret the results.