Circulation
Definition
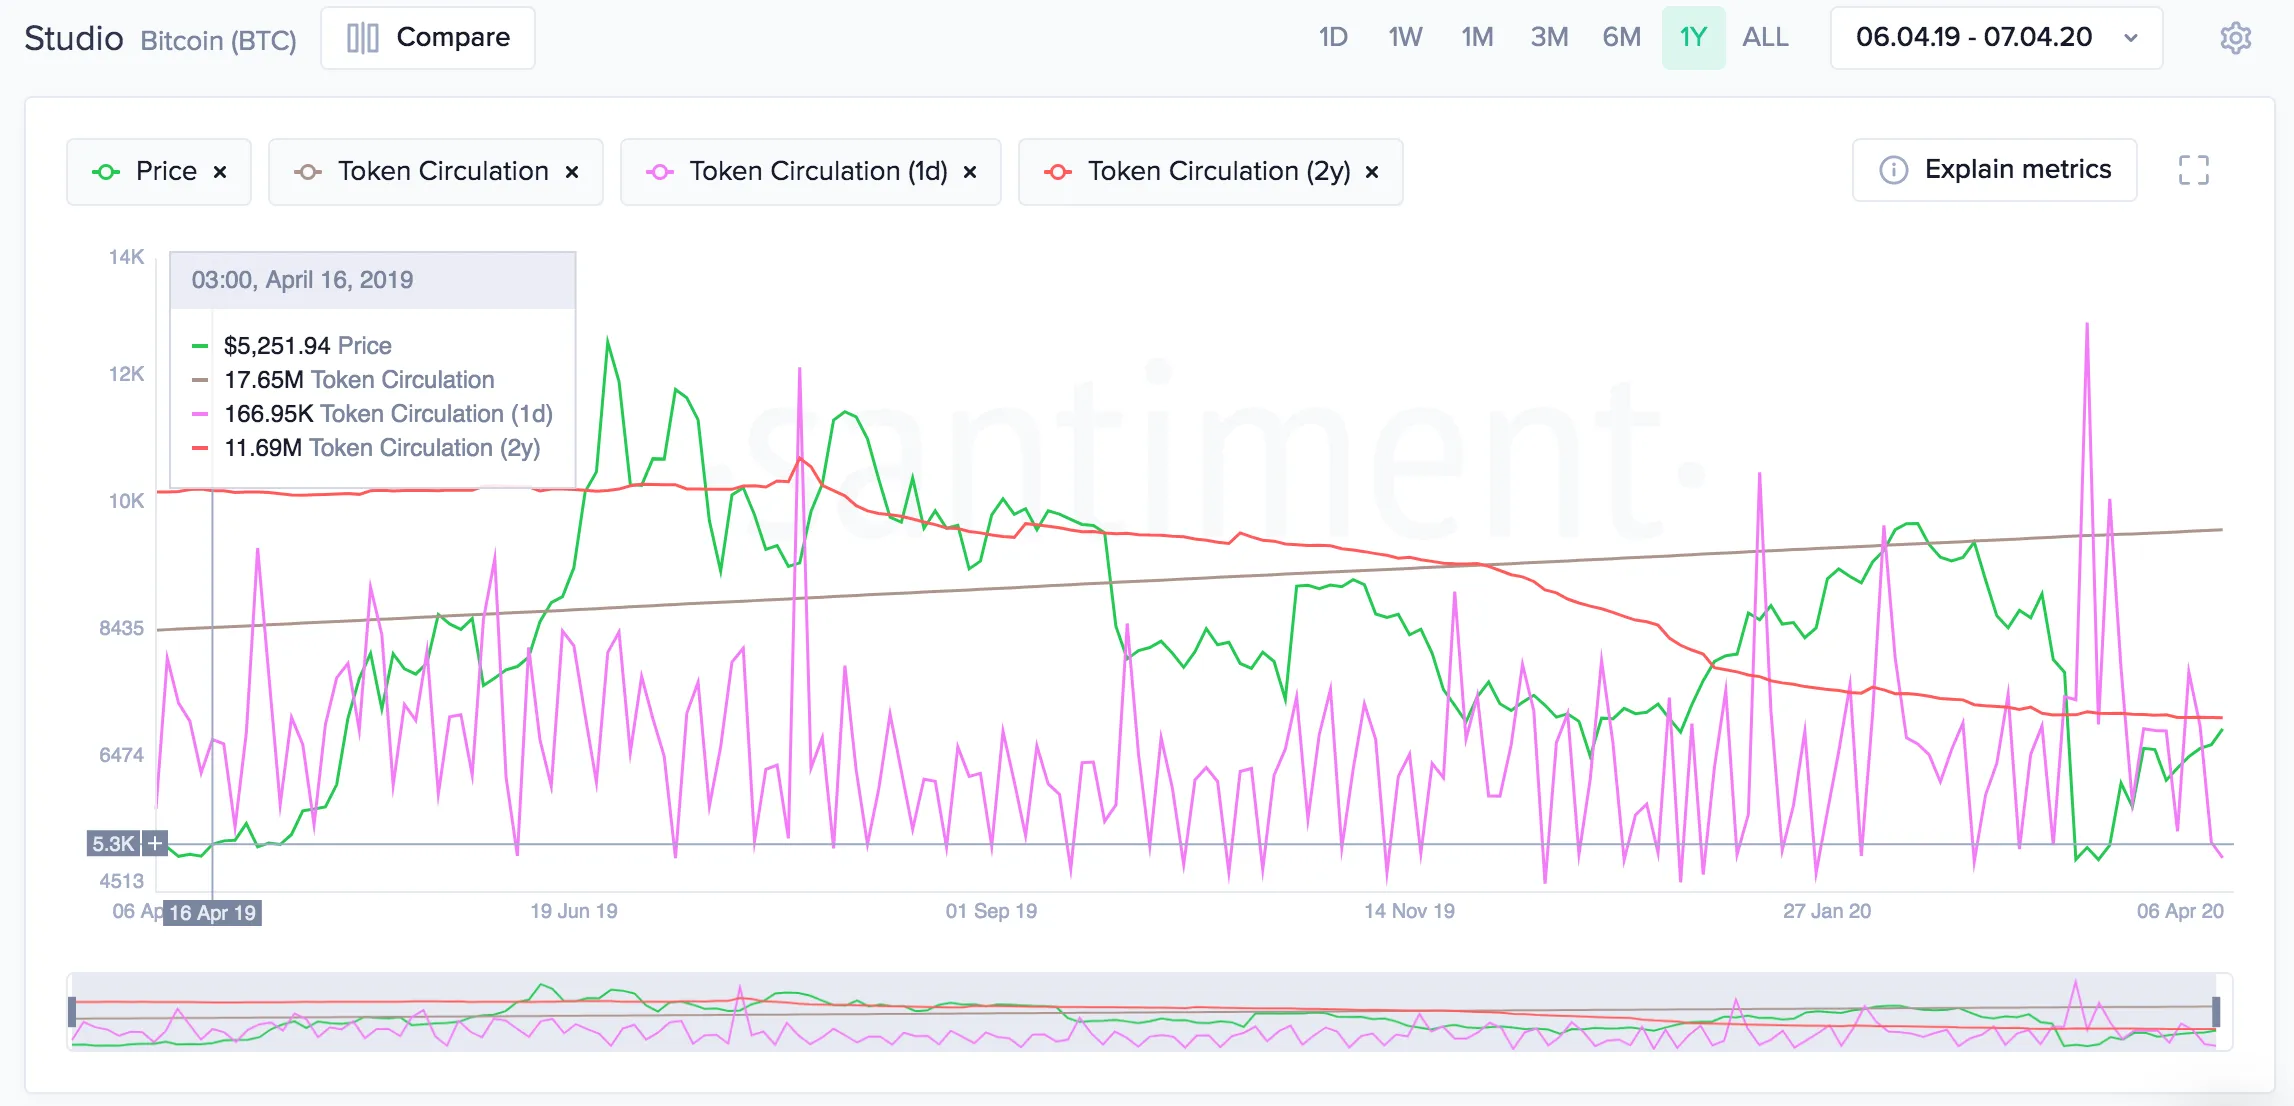
Circulation shows the number of unique coins/tokens being used during a time period.
Examples:
circulation_1d- Shows how many unique coins/tokens were transacted during a day. If one token/coin changes hands 5 times on a given day, it will be counted once by the token circulation, but 5 times by the transaction volume.circulation_1y- Shows how many unique coins/tokens were transacted for the past 1 year.
There are also circulation metrics circulation_usd_* that represent the USD value of all
unique coins or tokens that were transacted within a single day. Unlike simple circulation
metrics that count the unique cryptocurrencies moved, circulation_usd_* metrics convert
the quantity of these coins or tokens into their equivalent value in USD.
Access
Measuring Unit
Token/Coin amount
Data Type
Timebound
Change Metrics
Frequency
Latency
Available Assets
Available for these assets
Note:
circulationmetric and all circulation metrics are available for the same set of assets.
SanAPI
Available under the circulation and circulation_<timebound> names.
Gets the total amount of tokens that have been sent at least once during each day for a given time period. Projects are referred to by a unique identifier (slug). This metric is calculated daily, so the interval should be selected accordingly.
{ getMetric(metric: "circulation_1d") { timeseriesDataJson( slug: "santiment" from: "2020-01-01T00:00:00Z" to: "2020-01-07T00:00:00Z" interval: "1d" ) }}Without any suffixes like _1d, the metric returns the number of coins/tokens ever seen up until now, which is equal to the total supply at that datetime.
{ getMetric(metric: "circulation") { timeseriesDataJson( slug: "santiment" from: "2020-01-01T00:00:00Z" to: "2020-01-07T00:00:00Z" interval: "1d" ) }} Full List of Metrics
The full list of Circulation metrics is:
Open Metrics List
- circulation
- circulation_10y
- circulation_180d
- circulation_1d
- circulation_2y
- circulation_30d
- circulation_365d
- circulation_3y
- circulation_5y
- circulation_60d
- circulation_7d
- circulation_90d
- circulation_change_1d
- circulation_change_30d
- circulation_change_7d
- circulation_180d_change_1d
- circulation_180d_change_30d
- circulation_180d_change_7d
- circulation_usd_180d
- circulation_usd_180d_change_1d
- circulation_usd_180d_change_30d
- circulation_usd_180d_change_7d