Charts Handbook
Table of Contents
Overview
The Charts upgrade is live! Here’s all you need to know.
Purpose
We’ve upgraded our chart system to deliver a more powerful, intuitive, and user-friendly experience for cryptocurrency analysis and trading. This upgrade significantly improves the overall user experience (UX) through a redesigned interface and updated controls. It equips our community of traders and investors with cutting-edge capabilities to more easily navigate volatile crypto markets, spot opportunities, and execute data-driven strategies effectively.
What’s New
- Chart zoom and view controls updated to be more intuitive, aligning with other popular chart tools.
- New custom formula interface to replace combined metrics and offer more abilities for advanced users.
- Sidebar for quick access to recently viewed or saved chart layouts.
- Metrics selection now completely contained within the charts themselves, not the sidebar like before.
- Global asset selection control change & ability to lock metrics
Video Walkthrough
Getting Started
This section is broken into subsections with explanations, screenshots, and animated images for how to do various actions.
Selecting an Asset
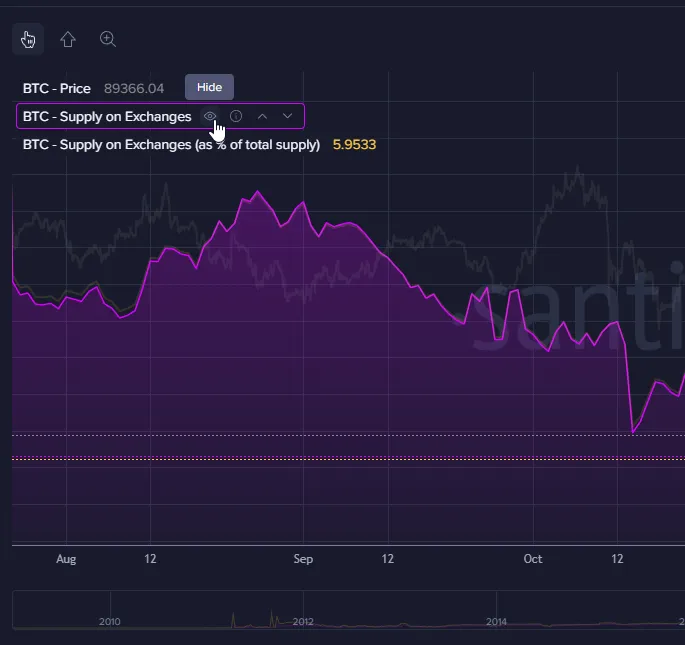
When opening charts you will see a single asset/metric combination on the top left corner: BTC, price. Click on BTC and a menu will appear where you may select an asset of your choice.
Chart Display Settings
- Changing color and other display settings for a specific metric: simply click on the metric and utilize the popup menu.
- New Drag mode to adjust the scale of the chart on both x and y axis or to move the current view left or right along the timeline.
- Shift mode lets you quickly analyze percentage changes in price, volume, or other metrics directly on the chart.
- Zoom mode let’s you select and zoom into a specific time range within your current view.
- Hide metrics from the chart using the eye icon to the right of each metric listed within the chart on the top right.
- Timeline below the chart allows you to select the time-period manually with sliders.
- Global time and granularity scale selector is at the very bottom, it adjusts all charts and metrics contained within the layout.

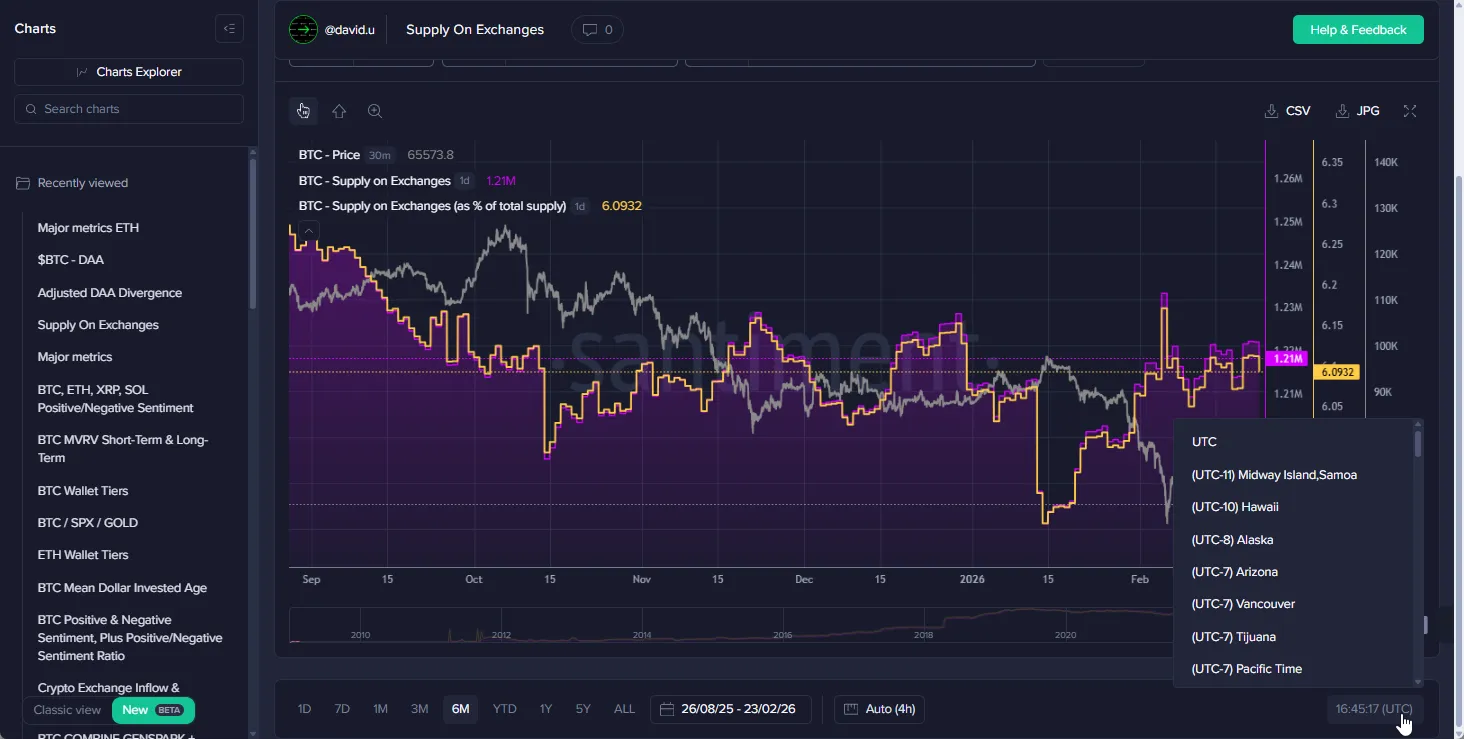
- Adjust for a specific timezone using the timezone selector on the right side of the Global time and granularity scale widget above.
- Hovering with your mouse over the chart displays a small menu at the bottom center of the chart. This allows you to add or remove charts and to move them up or down within the layout.
![]()
The Sidebar
The sidebar is a new addition that makes it easy to switch back and forth between different chart layouts. It links to the charts explorer page and includes a search field for accessibility. Below, the menu contains recently viewed layouts at the top and saved layouts further down.

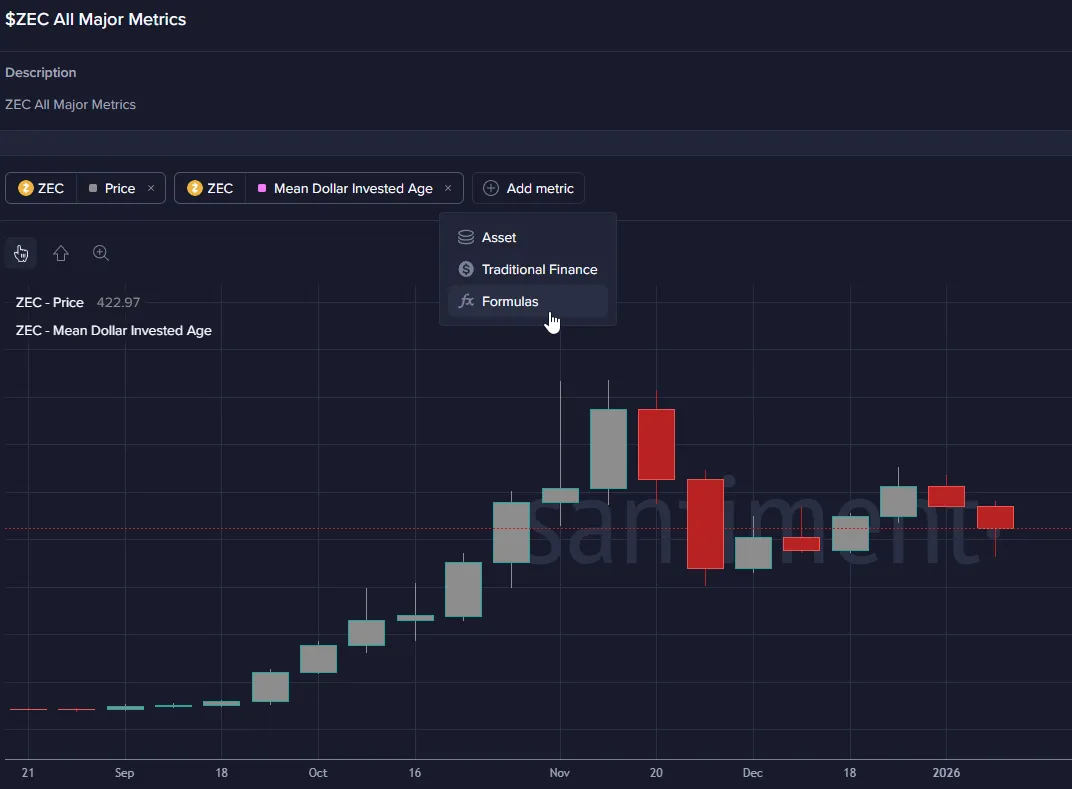
Adding Metrics
On the top left of the chart there is a button to “Add metric.” Metrics can only be added one by one.
Select one of the three options.
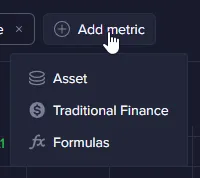
Asset Interface
Select from a list of over 3,000 crypto assets—covered above in the “Selecting and Asset” section.
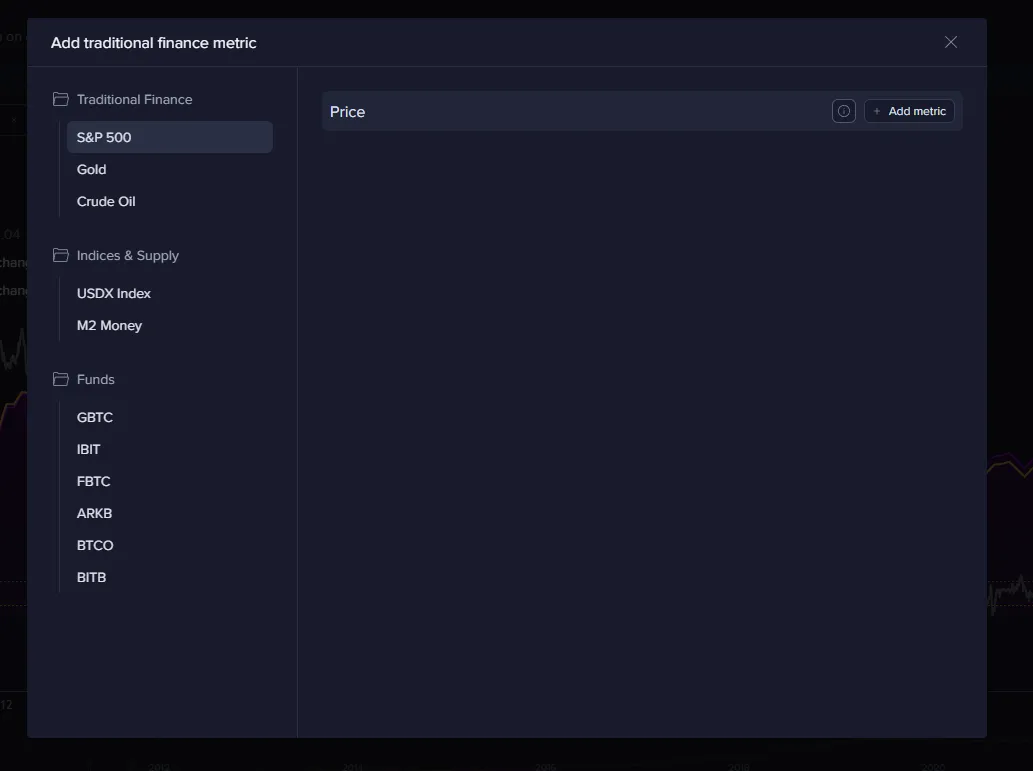
Traditional Finance Interface
Select from a list of popular tradfi assets. Metrics in this category are limited to price-only.
Formulas Interface
Combining Metrics
The “Combined metrics” interface is gone in this new version of charts, however, creating them is still possible through the formulas interface.
Method 1
Step 1: Add metrics you want to combine, one by one, to the chart.
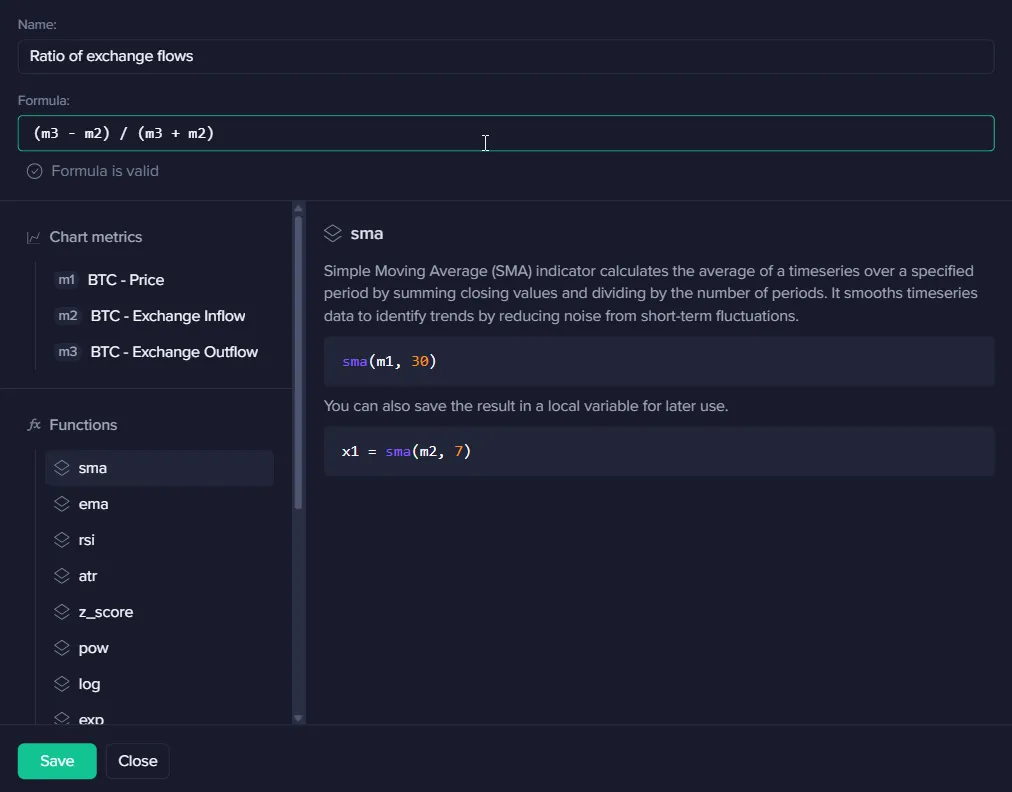
Step 2: Go to formulas interface
Step 3: Create formula with variables defined in the “Chart Metrics” tab on the top left. Below is an example of creating a ratio of exchange flows combined metric. The metrics added are represented as m1, m2, and m3. Step 4: Input your formula into the Formula field and click “Save”.
Note:
When changing the asset in your chart, the combined metric created with this method will change automatically.
Method 2
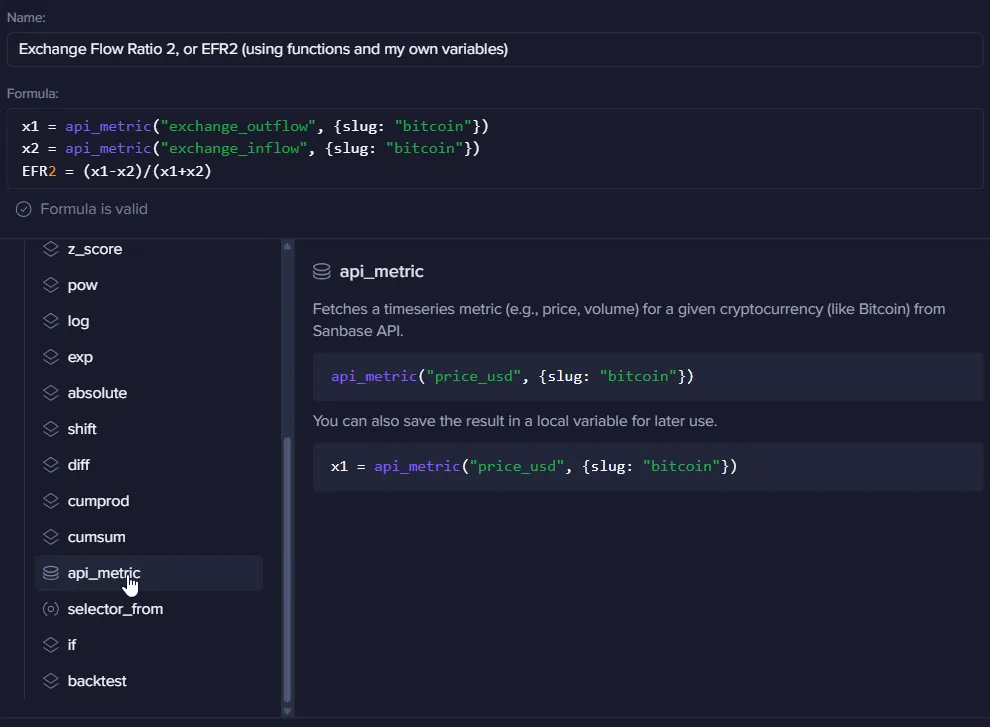
Create the combined metric using your own defined variables using the “api_metrics” function.
Guidelines:
- Look up metrics on Santiment Academy.
- Define the variables, each on their own line using the format:
A1 = api_metric("metric", {slug: "asset"})Note: the formula will appear for you, so you will only need to input the “metric” and “asset” of your choice. - Define the formula in a line below using the format: “name of combined metric” = formula
Note:
- When switching to a different asset on the chart, your “slugs” in the combined metrics using method 2 will not change automatically. You will need to go into the variable and change the asset manually. To get around this, use the
selector_fromfunction.
Changing the Formula for a Combined Metric or Formula-Based Metric
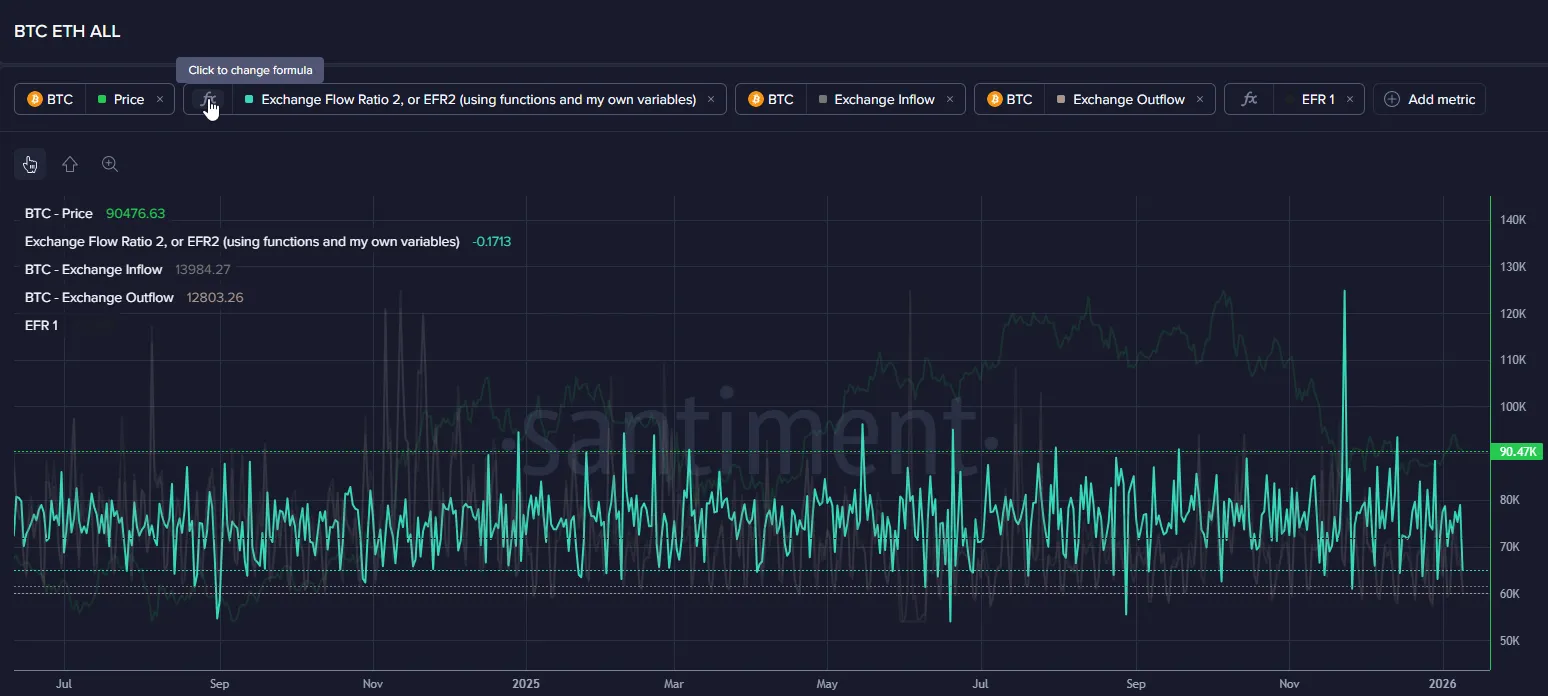
Simply click on the formula button on the left side of the metric directly above the chart. See image below:
Guides
Formula Interface Guide
The Formula Interface is a powerful tool that allows users to create personalized metrics, trading strategies, or conditional signals. These custom formulas allow you to combine existing chart metrics, define custom variables, apply mathematical functions, and be able to do so with a handy drag-and-drop UX. Once created, the formula is added as a new metric to your chart, where it can be visualized alongside price data. This interface is ideal for:
- Calculating more specific technical indicators (e.g., moving averages or RSI).
- Building trading strategies (e.g., buy/sell alerts based on conditions).
- Back-testing trading strategies.
- Creating composite metrics (e.g., Net Exchange Flow = Exchange Inflow - Outflow / Inflow + Outflow).
- Defining and visualizing “signals” (eg. see when MVRV spikes 15%+ within 24hrs)
Accessing the Interface
- Click the “Add Metric” button.
- Choose the “Formula” option.
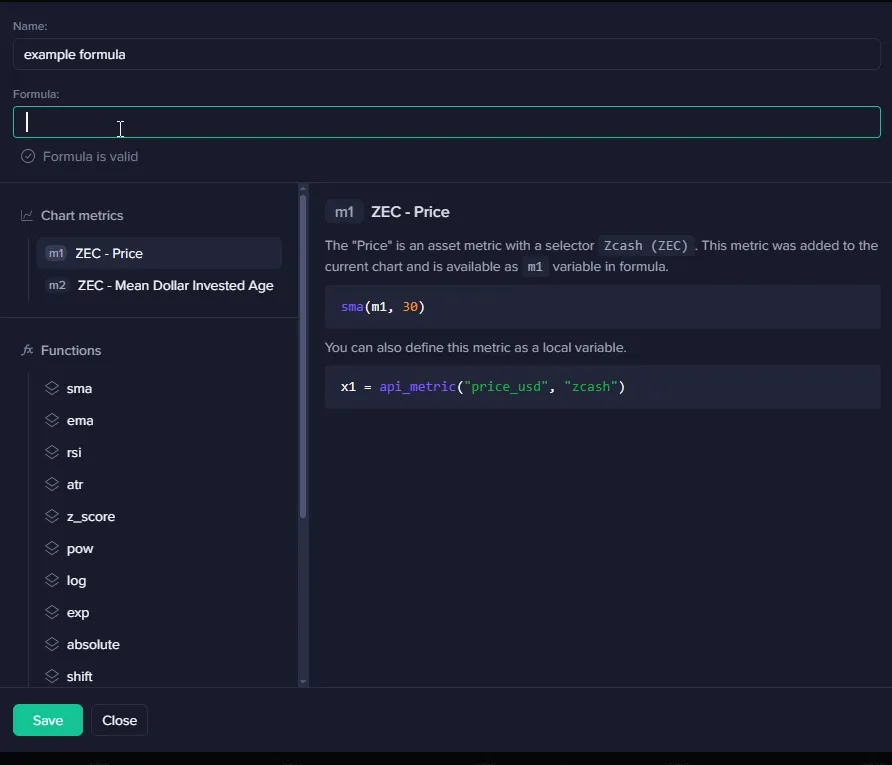
- The interface will pop up with fields for Name, Formula, and lists of available Chart Metrics and Functions.
Formula Name
- Purpose: Provide a descriptive name for your custom formula. This name will appear in the chart legend and metric list.
- Best Practices: Use clear, concise names like “ZEC_30Day_SMA” or “RSI_Buy_Signal”. Avoid special characters except underscores.
- Example: “ZEC_Price_SMA_30”
Formula
- Purpose: This is the primary field where you define the mathematical expression or logic. The formula can reference chart metrics (as variables like m1), functions from the list, custom variables, and basic operators (
+, -, *, /, etc.). - Validation: As you type, the system checks for validity. A green “Formula is valid” message appears when the syntax is correct; errors will highlight issues like unmatched parentheses, undefined or improperly named variables, and more.
- Supported Syntax:
- Arithmetic operators:
+, -, *, /, ^ - Comparison operators:
>, <, >=, <=, ==, !=(useful for signals) - Logical operators:
AND, OR, NOT(for conditional logic) - Parentheses for grouping:
(expression) - Conditional statements: Use ternary-like syntax, e.g.,
if(condition, true_value, false_value)
- Arithmetic operators:
- Example:
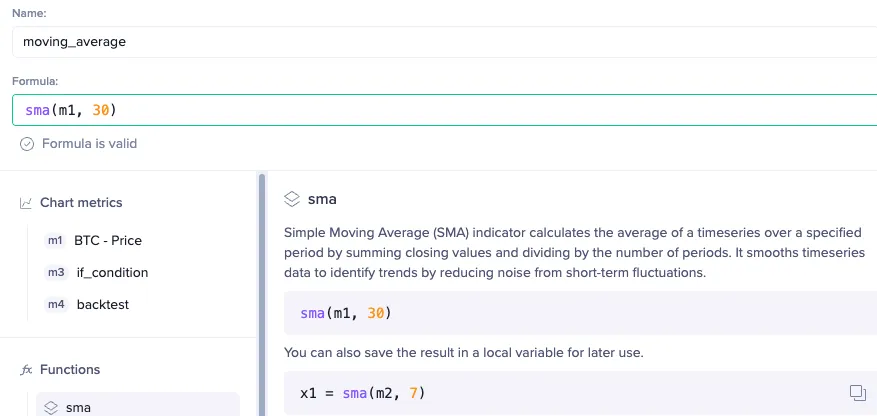
sma(m1, 30)creates a 30-interval simple moving average of the price metric.
Chart Metrics
- Purpose: This section lists metrics already added to your current chart, available as variables in your formula. Each metric includes a description and variable name (e.g., m1 for the first metric).
- How It Works: Metrics are auto-populated based on your chart. For instance:
- m1 ZEC - Price: Represents the current price of Zcash (ZEC) in USD. Use as m1 in formulas.
- m2 ZEC Mean Dollar Invested Age: A calculated metric like the average age of dollars invested in ZEC.
- Adding Metrics: If a needed metric isn’t listed, close the interface, add it to the chart first, then reopen.
- Example Usage: In the formula, reference m1 for price data, e.g.,
rsi(m1, 14)for a 14-period RSI.
Functions
- Purpose: A library of built-in functions for technical analysis, math, and data manipulation. Hover over a function for a tooltip with parameters and description.
- Available Functions:
- sma(source, period): Simple Moving Average. Example: sma(m1, 30) averages the price over 30 periods.
- ema(source, period): Exponential Moving Average. Weights recent data more heavily.
- rsi(source, period): Relative Strength Index. Measures momentum; typically 14 periods.
- atr(source, period): Average True Range. Volatility indicator.
- z_score(source, period): Z-Score. Standardizes values for anomaly detection.
- pow(base, exponent): Raises base to the exponent power.
- log(value): Natural logarithm.
- exp(value): Exponential function (e^value).
- absolute(value): Absolute value.
- shift(source, periods): Shifts the data series by the specified periods (positive for lag, negative for lead).
- diff(source): Difference between current and previous value. e.g., diff(m1) computes price change period-over-period.
- cumprod(source): Cumulative product of the series. Useful for compounded returns.
- cumsum(source): Cumulative sum of the series. e.g., cumsum(volume) tracks running total volume.
- api_metric(metric_type, asset): Fetches API metric data for a given asset.
- selector_from(asset): Creates or references an asset selector for use in other functions.
- if(condition, true_value, false_value): Conditional evaluation. e.g., if(rsi(m1, 14) > 70, 1, 0) flags overbought conditions.
- backtest(strategy_logic): Simulates a strategy over historical data and returns performance metrics (may output equity curve, signals, or stats depending on implementation).
- Advanced Usage: Define local variables in the formula for clarity, e.g., x1 = api_metric(“price_usd”, “zcash”). Note that local variables cannot contain spaces or special characters.
Creating a Custom Formula: Step-by-Step
- Enter a Name for your formula.
- In the Formula field, start by referencing a chart metric (e.g., m1).
- Apply functions as needed (e.g., sma(m1, 30)).
- Optionally, define local variables for complex formulas, like x1 = api_metric(“price_usd”, “zcash”); sma(x1, 30).
- Test validity – ensure “Formula is valid” appears.
- Click Save to add the metric to your chart.
- Close if you need to cancel or edit later.
Examples Simple Metric: 30-Period SMA of Price
- Name: ZEC_30_SMA
- Formula:
sma(m1, 30) - Result: Adds a smooth line on the chart showing the 30-period average price of ZEC.
Trading Strategy: RSI-Based Buy Signal
- Name: RSI_Buy_Signal
- Formula:
if(rsi(m1, 14) < 30 , 1 , 0) - Result: Plots a line on the chart where conditions are met.
Composite Metric: Z-Score of Volume
- Assume m3 is a volume metric added to the chart.
- Name: ZEC_Volume_ZScore
- Formula:
z_score(m3, 20) - Result: Highlights unusual volume spikes relative to the past 20 periods.
Advanced with API: Cross-Asset Comparison
- Name: ZEC_vs_BTC_Price_Ratio
- Formula:
x1 = api_metric("price_usd", "zcash") x2 = api_metric("price_usd", "bitcoin"); x1 / x2 - Result: Plots the price ratio of ZEC to BTC.
Best Practices and Tips
- Start Simple: Begin with basic functions before combining them.
- Performance: Avoid overly complex formulas with many API calls.
- Debugging: If invalid, check for typos in variable names (case-sensitive, spaces, or special characters) or missing parameters in functions.
- Units and Scaling: Ensure metrics are in compatible units (e.g., don’t divide price by volume without normalization).
- Signals: For buy/sell signals, use conditional logic to output values like 1 (buy), -1 (sell), or 0 (neutral). These can trigger chart annotations.
- Compatibility: Formulas work on various timeframes (e.g., 1-hr to daily charts), adjust periods accordingly.
Troubleshooting
- Invalid Formula: Double-check syntax, parentheses, and referenced variables. Ensure all metrics are added to the chart.
- No Data: If a metric returns null, verify the asset selector or slug (e.g., “zcash”) and API availability.
- Error Messages: Common issues include “Undefined variable” (add the metric) or “Invalid function” (check spelling).
- Contact Support: If issues persist, click the green “Help and Feedback” button provide a screenshot of the interface and your formula for assistance. Alternatively, share the issue in our discord server.
Creating and Backtesting Strategies
-
Come up with a strategy idea
I have a assumption, that I want to open long position when price > 30 day moving average, and exit when it’s not.
-
Add needed metrics
- BTC price - named as
m1 - BTC 30 day moving average - named as
m2Create using the formula interface using thesmafunction to define the specific metric. See image below for reference.
- Save the new metric and add a new one to the chart, go to the formulas interface again
- Specify the strategy using the
backtestfunction details in next section.
- BTC price - named as
Backtesting the Strategy
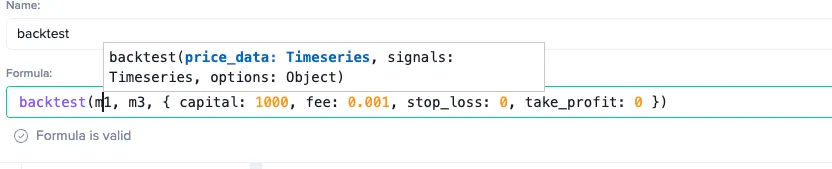
-
Understand the
backtestfunctionIt accepts 3 parameters, separated by commas:
- price_data - the asset price we want to backtest on, in this case, BTC price
- signals - this will determine our positions: direction and size
- options - we will ignore this for now
-
Design the signal
Remember our strategy?
1. if price > 30 day moving average, we go all in, to open long position2. Else, we hold no positionwhich will be translated into:
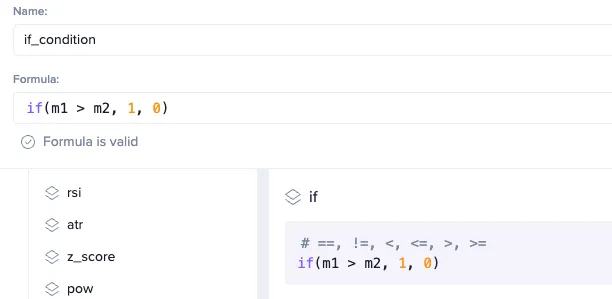
iffunction also accepts 3 parameters:- condition
- The return value, if the condition stands - in this case it’s 1, meaning we use 100% of our position
- The return value, if the condition fails - in this case it’s 0, meaning we use 0% of our position - meaning we are doing absolute nothing
Note: this explanation is just to make life a bit easier. Back to the origin, the
iffunction is just used to return values in different situation, and can return any numbers. Only when it goes intobacktestfunction, that’s when numbers get associated with position size.1 means 100% long position0 means no position-1 means 100% short position0.5 means 50% long position-0.3 means 30% short position -
Create the backtest function
Now we have everything.
- First parameter:
m1, which is the BTC price - Second parameter:
m3, which is the if condition statement, we created in step 3 - Third parameter, the scary long brackets, we ignore it for now
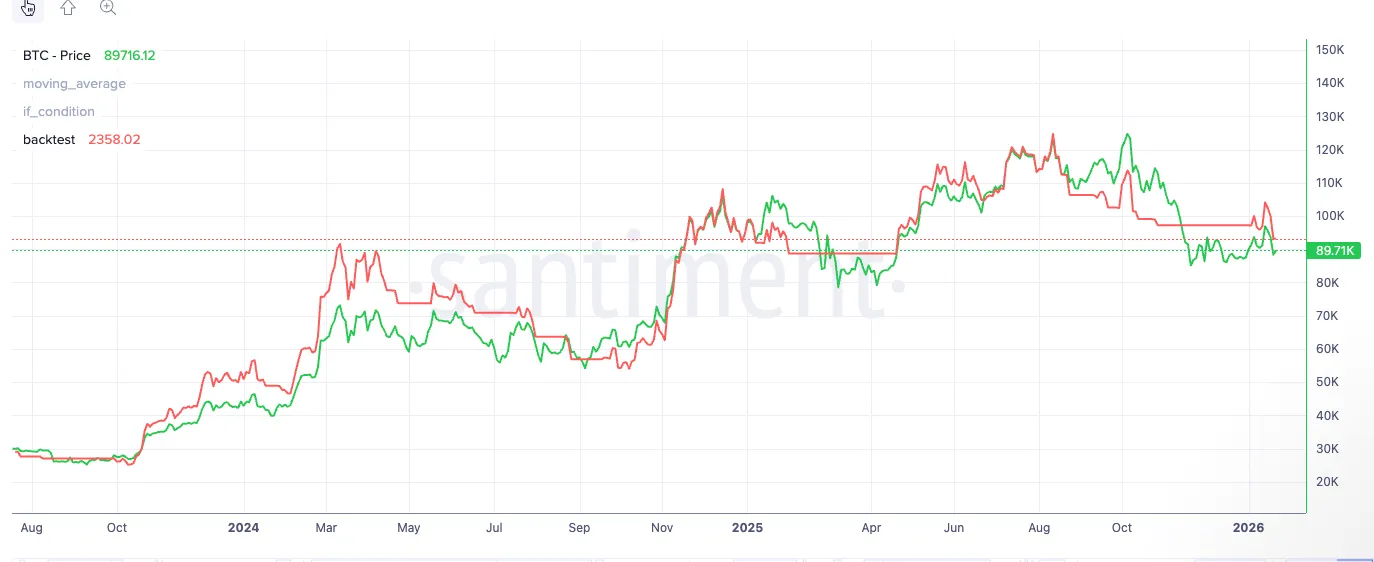
Press save, now we have a curve shows our net value!
- (Optional) Clean the chart
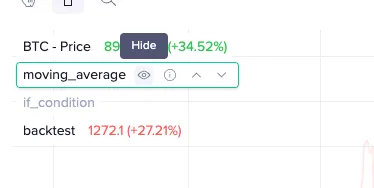
In the top left corner of the graph, we can hide our intermediate metrics, to make it look a bit clean.
Old vs New Comparison Images
Former charts default screen
New charts default screen (won’t have until launch)
Former gobal asset selector vs new global asset selector
Former add metric flow vs new add metric flow
Former chart display settings vs new chart display settings