Mean Realized Price
Definition
The Mean Realized Price metric calculates the average price at which tokens were obtained. It provides insights into the average profitability of token transactions by considering the Realized Value against the Total Circulating tokens. It can be understood as the price level that acts as support or resistance.
The Mean Realized Price metric is also available for different time bounds, which compute the mean realized price for tokens moved at least once no longer than a specific number of days or years ago.
Bottom Indicator Use Case
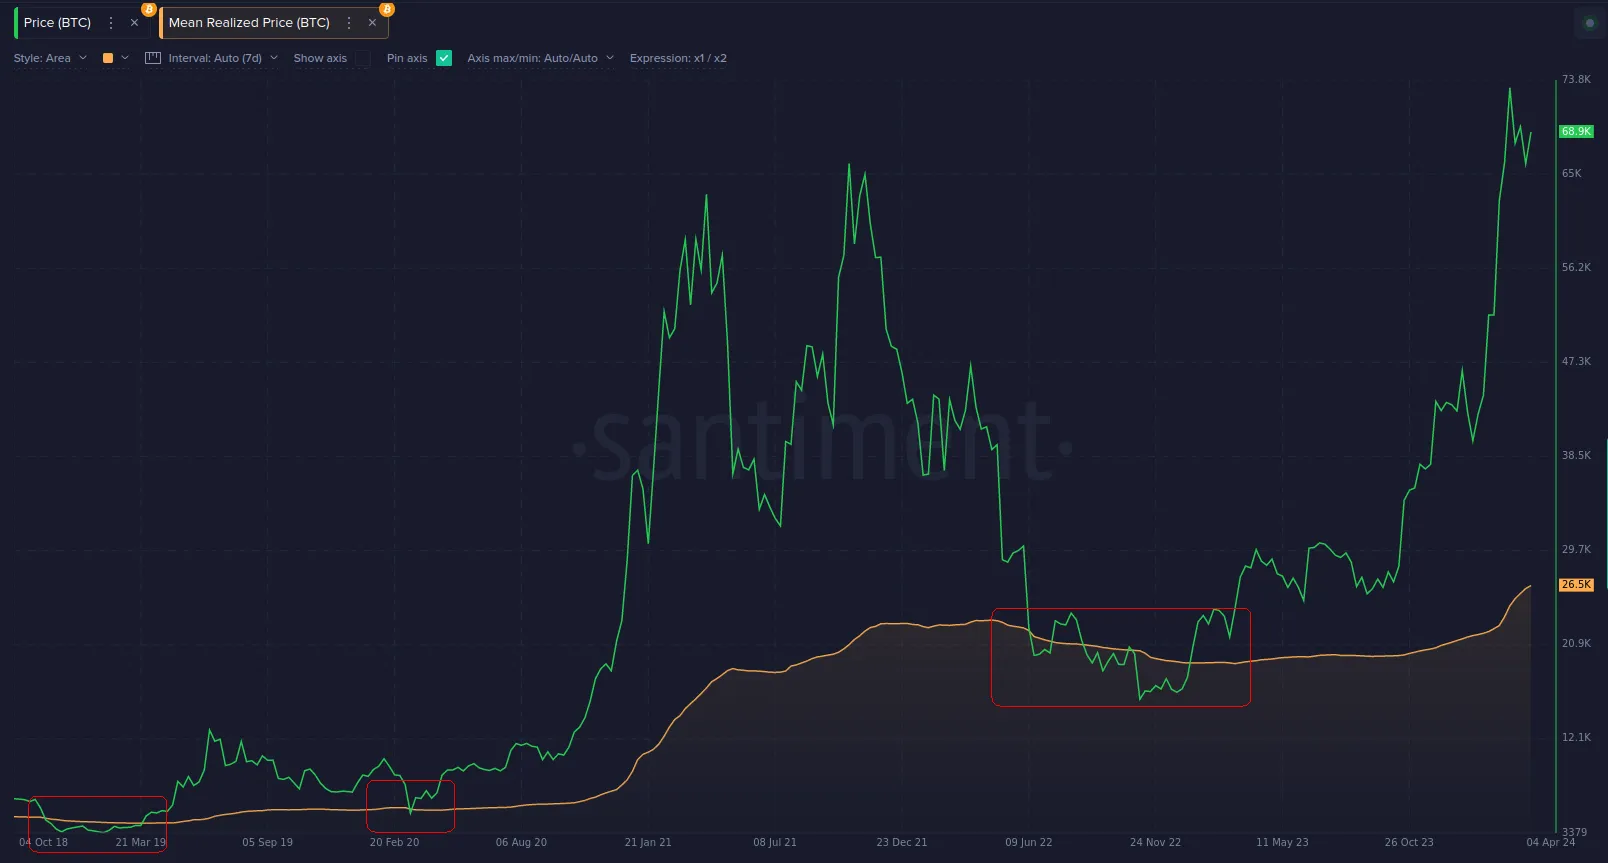
The Mean Realized Price carries considerable weight for crypto investors. In times of market instability, it serves as a crucial indicator. If the price falls below the Mean Realized Price, it suggests that, on average, token holders are facing unrealized losses. These periods are highlighted on the chart above (red rectangles), and investors view them as opportunities to accumulate more tokens.
Access
Timebound
Timebound Metrics available
Measuring Unit
USD
Data Type
Frequency
Latency
Available Assets
Available for these assets
Note:
mean_realized_price_usdmetric and all timebound realized value metrics are available for the same set of assets.
SanAPI
Available under the mean_realized_price_usd and mean_realized_price_usd_<timebound> names.
{ getMetric(metric: "mean_realized_price_usd") { timeseriesDataJson( slug: "santiment" from: "2020-01-01T00:00:00Z" to: "2020-01-07T00:00:00Z" interval: "1d" ) }} Full List of Metrics
Mean Realized Price metrics
- mean_realized_price_usd
- mean_realized_price_usd_1d
- mean_realized_price_usd_7d
- mean_realized_price_usd_30d
- mean_realized_price_usd_60d
- mean_realized_price_usd_90d
- mean_realized_price_usd_180d
- mean_realized_price_usd_365d
- mean_realized_price_usd_2y
- mean_realized_price_usd_3y
- mean_realized_price_usd_5y
- mean_realized_price_usd_10y